Tektronix TDS 754D, Four Channel Digital Phosphor Oscilloscope
Introduction
Over the past two years, I have acquired a decent amount of Tektronix analog oscilloscopes. I would say “decent amount” because having 10+ oscilloscopes is not that much compared to other Tektronix enthusiasts. Nevertheless, my colleagues already started questioning my sanity. Different topic. I really like Tek analog oscilloscopes and I love to work with them. However, doing everyday measurements in analog has its downsides in terms of comfort and workflows. It was about time to go digital!


Analog vs Digital
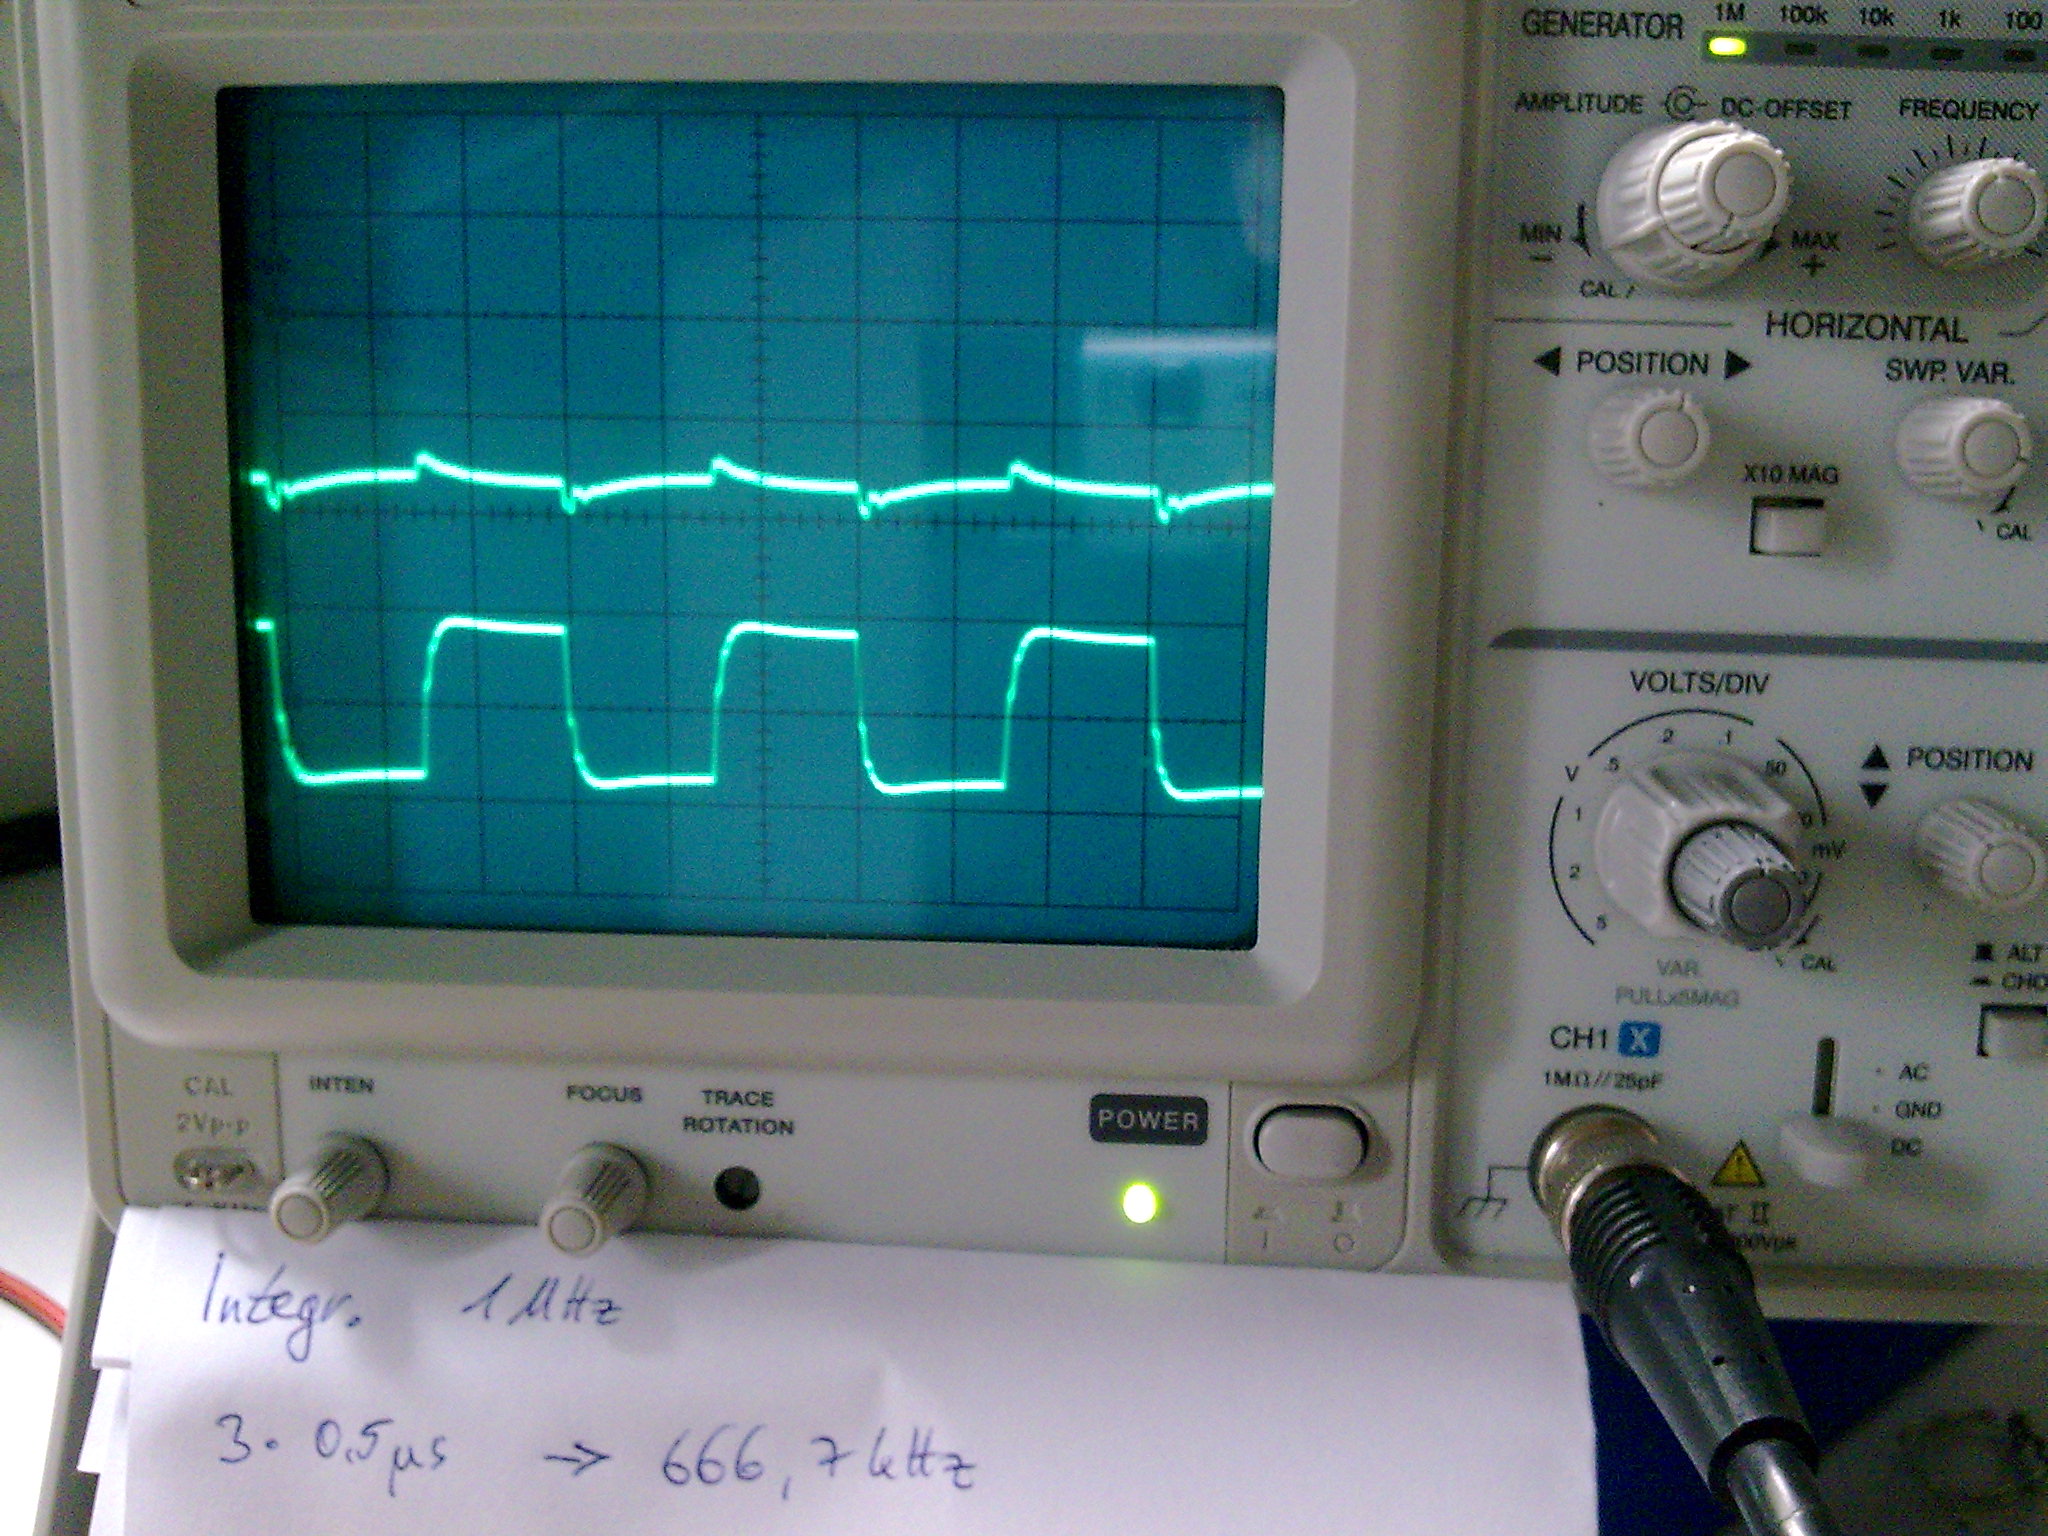
Do you want to do a “quick” measurement and document it? Sure: turn on the oscilloscope, set the ranges/triggering and observe the electron beam trace! Experienced users can set up the measurement in seconds to less than a minute. However, when it comes down to taking quantitative measurements, this process may take a while. If the values of the amplitude, phase or frequency of a signal are not of importance, e. g. one does qualitative measurements where just the shape of the signal is of interest (sinewave, squarewave, noise), the measurement can be done in a matter of seconds. However, if quantitative measurements are of importance (amplitude, phase, frequency, risetime), the average user will spend a lot of time counting the marks on the graticule which can be prone to errors, too.
In order to document the measurements, one has to take photographs of the screen. Unfortunately, some analog oscilloscopes have no measurement annotations on the screen. The user has to take care of this – it can be a huge trap for young players. I’ve been there before and it wasn’t easy figuring out why I have 13 pictures of oscillograph curves but only 10-ish lab notes documenting the oscilloscope settings… Which setting did I use for Channel 1 and Channel 2? Why are the images blurry? How about those annoying reflections on the screen? Another downside of an analog oscilloscope would be of a “first-world-problem” type: at very low frequencies (in the range of few Hz), it’s very difficult to view a complete image of a single waveform. The electron beam sweeps too slowly across the screen – it doesn’t leave a persistent trace which makes reliable measurements difficult. However, it is possible to view single waveforms with an analog storage oscilloscope.

Fast-forward to the 1990’s to 2020’s – the era of digital oscilloscopes. The early digital models were slow and limited in their measurement capabilities. The advances in technology (improved analog-to-digital converters, more RAM and storage, digital signal processing, automation) helped digital oscilloscopes to become very powerful instruments. As the name suggests, a digital oscilloscope converts an analog signal into a digital one. Once the time-dependent (analog) voltage has been converted into basically numbers, one can play with waveforms and do useful calculations. It’s very easy to calculate values such as min/max/average or standard deviation. Implementation of sophisticated signal processing algorithms opened the doors to Fast Fourier Transform (FFT), logic analysis, complex triggering and much much more. Digital oscilloscopes also have one huge advantage over their analog counterparts: one can capture and store a single waveform for viewing (e. g. zoom in in order to see more details). Tektronix released a very nice publication on this matter, The XYZs of Oscilloscopes Primer. It can be downloaded for free from Tek’s website.
Purchase Criteria for a Digital Oscilloscope
In my case, I just needed a general-purpose digital oscilloscope in order to make quick measurements and do the documentation stuff.
Now what to look for? The key specifications would be: number of channels, analog bandwidth, sampling rate, memory and vertical resolution. Modern-day oscilloscopes have all kinds of additional features such as interfaces (USB, RS-232, Ethernet, GPIB), touchscreen display, integrated digital multimeters, VGA/HDMI/DisplayPort, input termination (1 MΩ/50 Ω) and much more. Those features can improve your workflow and speed up your work. I should mention that the size of the oscilloscope can be important, too. Digital oscilloscopes can be very compact and take almost no space on the bench compared to their analog counterparts. This is important for people with space constraints like a student’s living room or a small garage. There is one more parameter which sums up the features: the price 🙁
I’ve scrambled few hundred Euros in order to buy myself a 2nd hand digital oscilloscope. Since 2010’s/2020’s oscilloscopes are a little bit too expensive, I’ve looked into the mid 1990’s to mid 2000’s era digital oscilloscopes. By the end of 1990’s, digital oscilloscopes had quite potent measurement capabilities. Tektronix and Agilent Technologies (successor to Hewlett-Packard, now Keysight Technologies) designed excellent oscilloscopes for all kinds of applications – mobile communications, digital design and debugging, video and others. Other brands to consider would be Fluke/Philips, Hameg (today Rohde & Schwarz) or LeCroy. Fast-forward 25 years into the future and a 1990’s 20k USD high-end oscilloscope can be bought today in the order of just few hundreds Euros. I guess the only reason I’m stuck with Tektronix oscilloscopes in general is their excellent documentation (User and Service Manuals) and the ability to repair it according to the documentation. Huge props to Kurt of TekWiki and also to all the TekWiki contributors and enthusiasts which maintain the wiki pages and manuals archives. Another invaluable source of Tektronix-related information is the mailing list TekScopes@Groups.io.
Speaking of few hundreds of Euros: the price range below 1k EUR is in direct competition with modern-day digital oscilloscopes! I certainly had considered whether to spend let’s say 500 EUR on a new Rigol oscilloscope (which can be hacked/upgraded to a multi thousand dollar machine) or on a 25 year old vintage chobby which has possibly seen darkness, torture, abuse and failures. I’ve been hesitating buying different brands such as PeakTech, Rigol, Siglent or UNI-T for different reasons. Don’t get me wrong – they manufacture great and affordable oscilloscopes. The devil is in the details.
Tektronix TDS 754D Series Oscilloscope
The Tektronix TDS Series seemed to fit very well in my scope scheme. I was looking for a decent amount of analog bandwidth (at least 400 MHz), a high sampling rate (if possible 5x to 10x the analog bandwidth) and 4 channels. Tektronix TDS 784D came in my mind because it had everything I needed. Unfortunately, it wasn’t available at the time on German markets like eBay or eBay-Kleinanzeigen (German analogy to craigslist). So I was looking for a suitable alternative. The EEVBlog community has quite a few threads on TDS Series oscilloscopes. One in particular was interesting: the models TDS 754D and 784D are electronically nearly identical. It is possible to convert a TDS 754D model (500 MHz bandwidth) into a TDS 784D (1 GHz bandwidth) by means of a small modification. This modification (removing a resistor and few capacitors) is well documented and can be done very easily. Since there were few Tek TDS 754D oscilloscopes on the market, I thought to give it a try.
First Impression


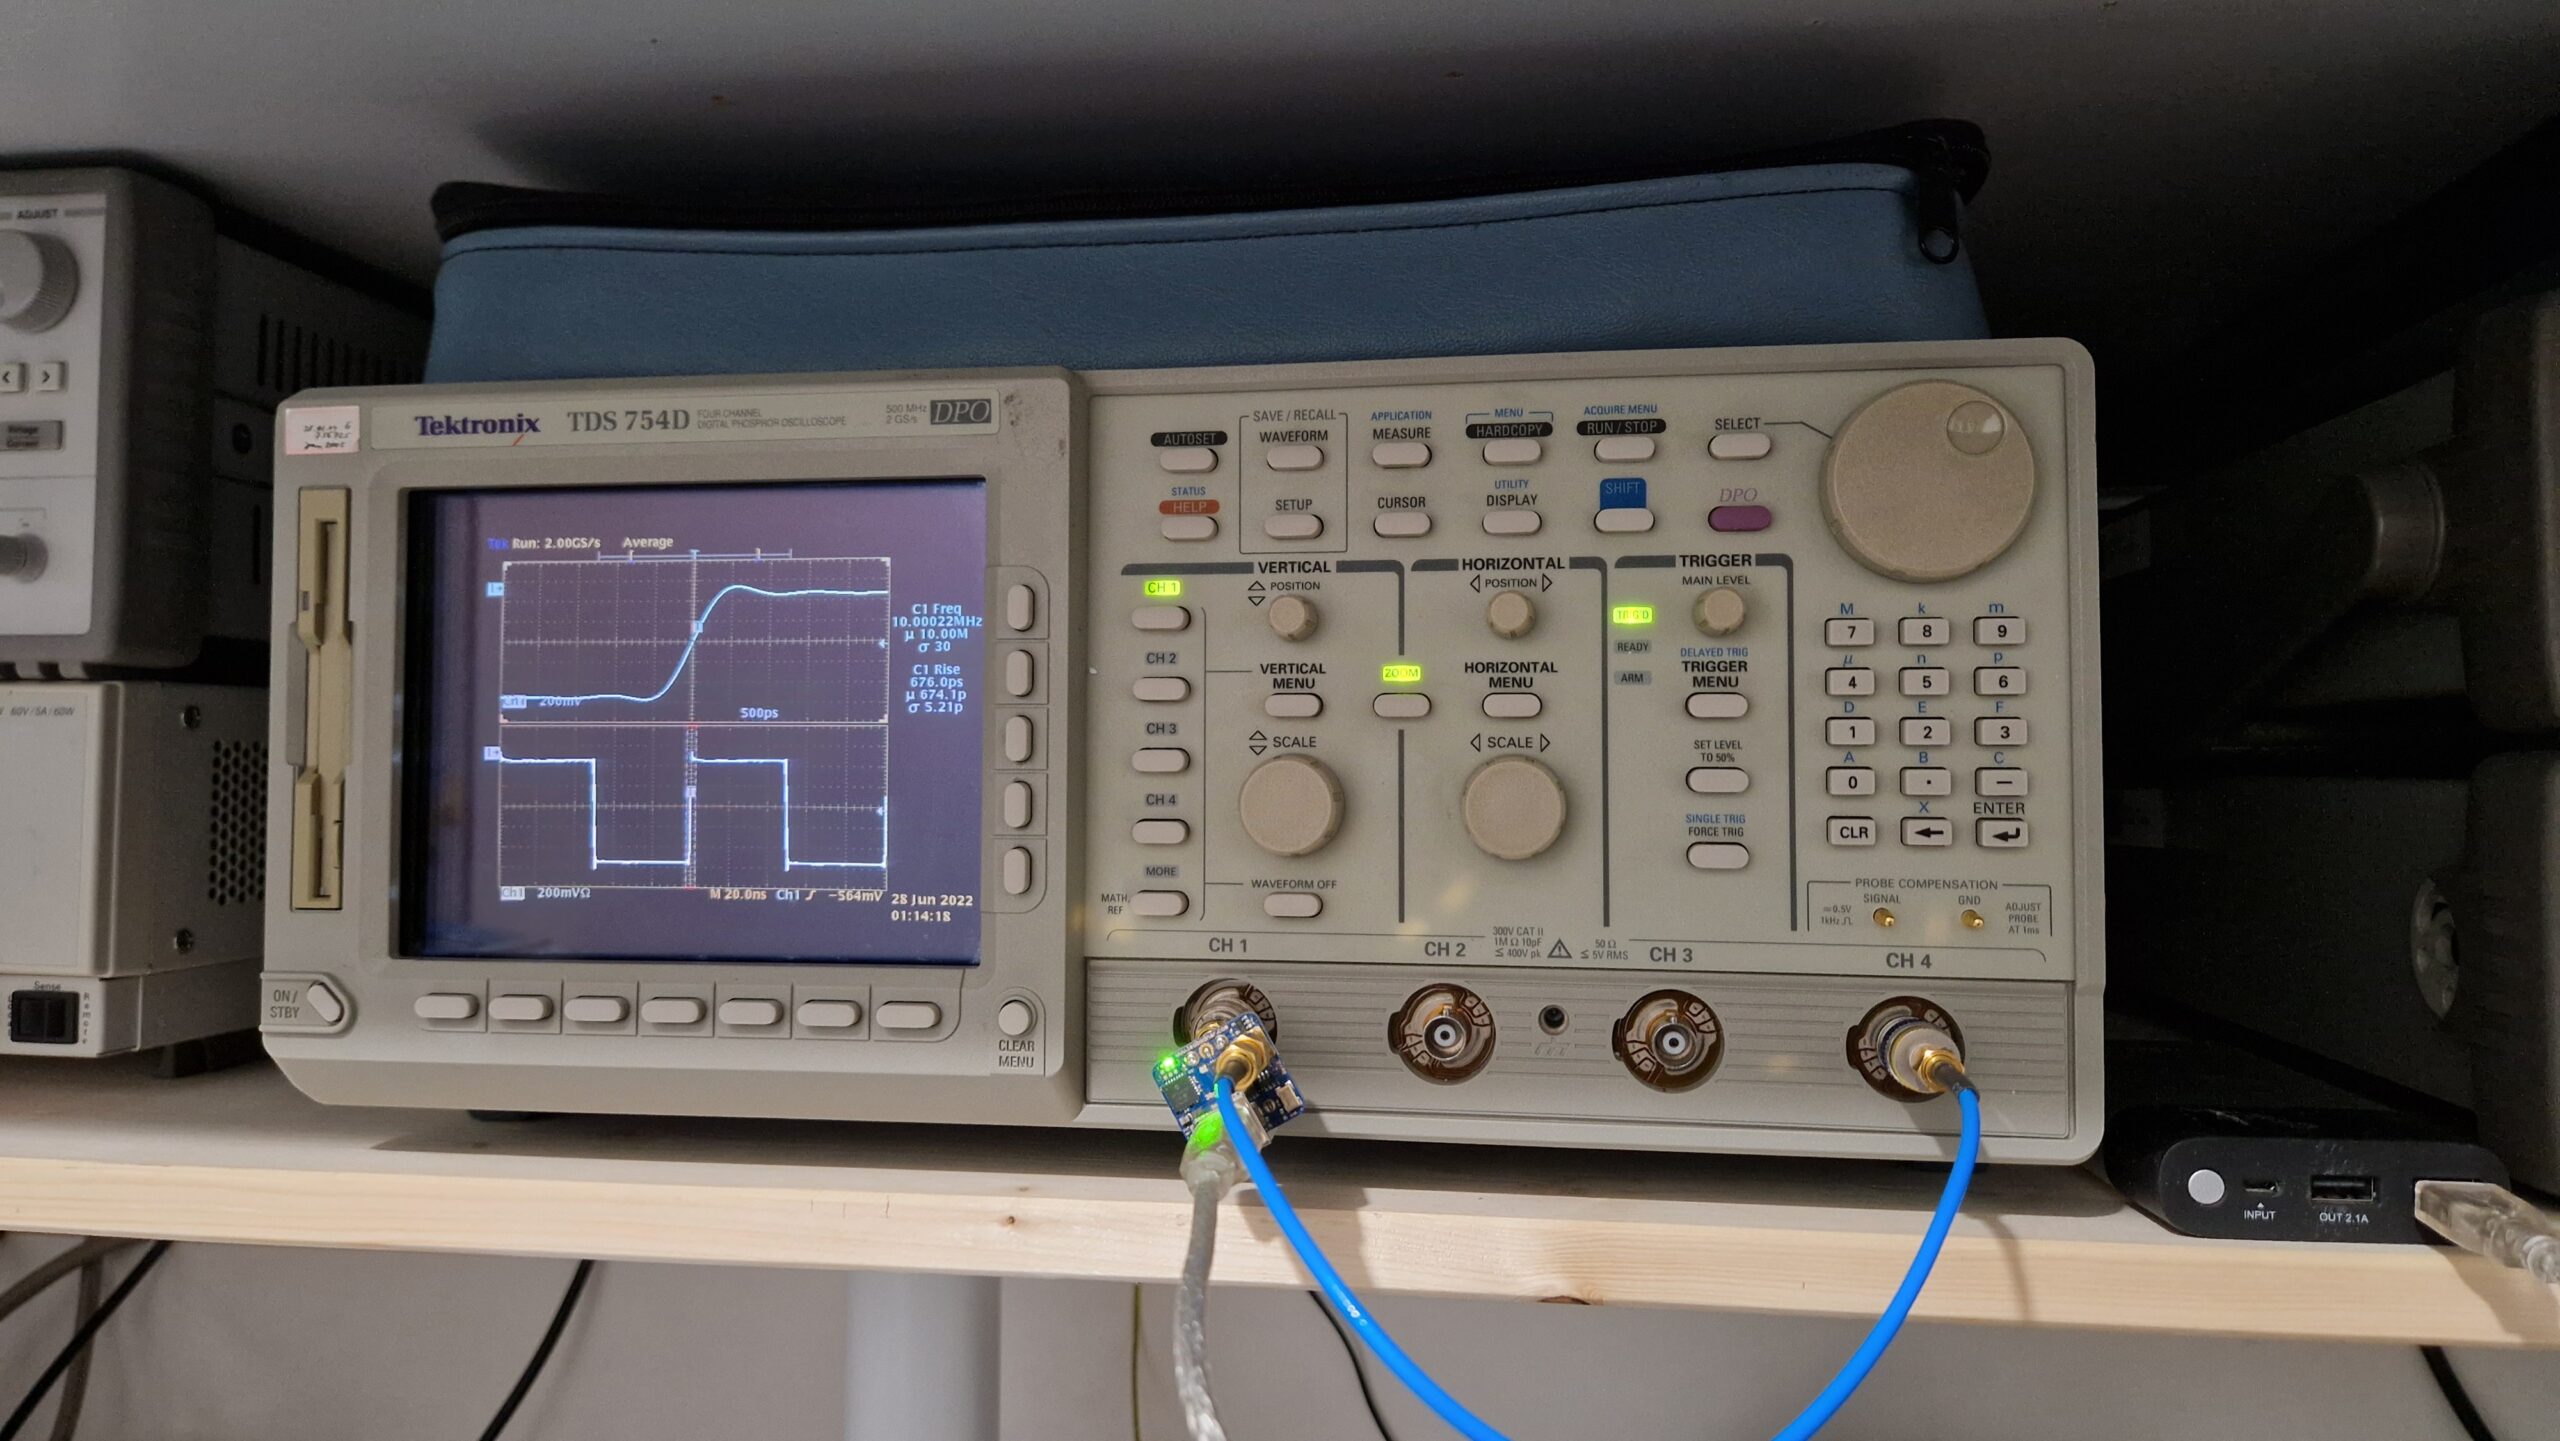


Tektronix TDS 754D is a compact unit when compared to my 7000 Series “boat anchors”. It has a very clean designed front panel, color display and vents for a large fan (approx 15 cm diameter) on the left hand side. The noise generated by the fan is a little bit annoying but tolerable. Since the heat generated by the oscilloscope has to be carried away, it’s crucial to maintain a proper airflow. There are many ventilation slots on the housing which need some clearance, otherwise the oscilloscope may be damaged due to overheating. Booting up the device takes about a minute and the warm-up time is at least 15 minutes. The color display is a little bit strange: while moving my head, the display colors are splitted into their red/green/blue components (color fringing). This is a little bit annoying but on the other hand, the image quality (in resting position) is very good – sharp image, rich colors, “dark theme” which is pleasing for my eyes when working in dim or darker environments. The oscilloscope takes quite a lot of space on the workbench. Placing the oscilloscope outside of ergonomic positions is not recommended because one has to push many buttons and turn the knobs in order to find optimal settings.
Quick Check of the Four Channels


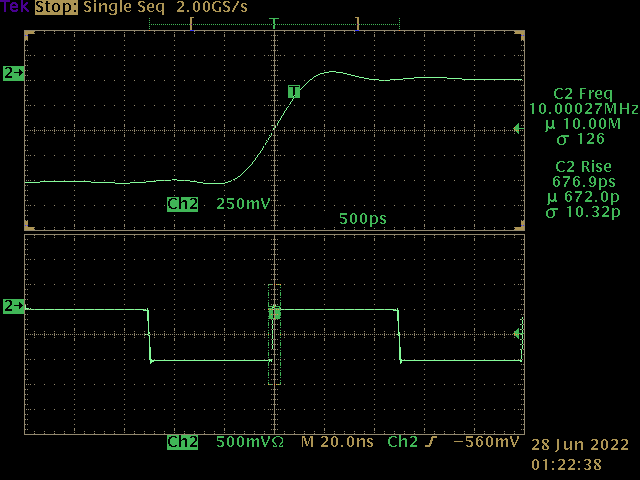
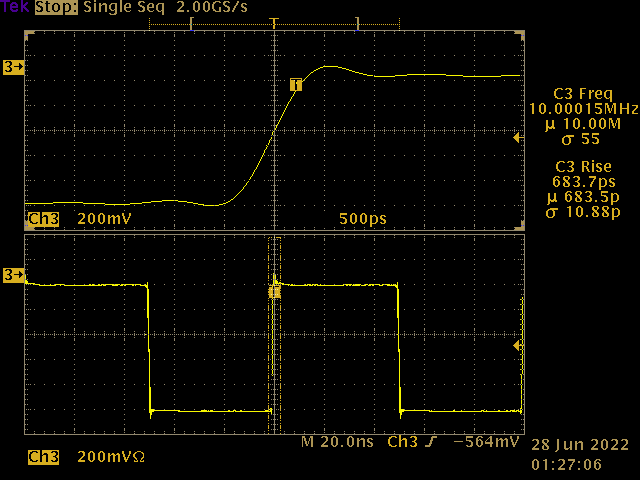

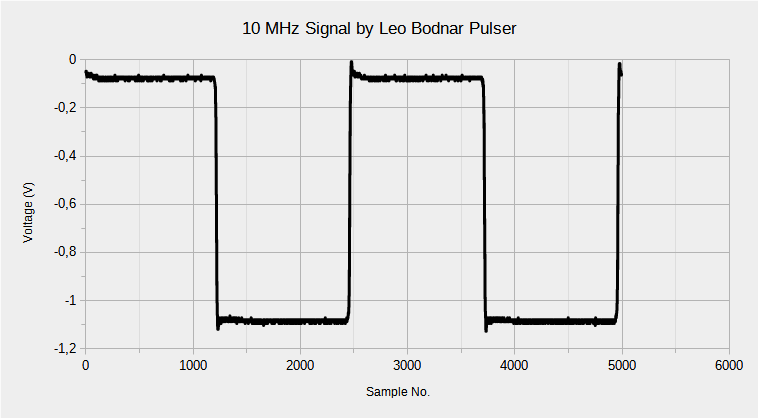
The pictures provided by the seller showed a deviation on Channel #2 which was a little bit worrying. He attached the probe and got no signal displayed. The root of cause could have been anything ranging from a defective channel to false user setting. Luckily, it turned out to be a false setting by him. All four channels were tested with a function generator in 50 Ω and 1 MΩ (“High Z”) terminations. The amplitude was set to 1 Vpp at various frequencies – The sine waveforms were clean without any visible noise or distortion. I was able to test the analog bandwidth with my Leo Bodnar Fast Pulse Generator. It generates a 10 MHz squarewave with a very steep rising edge. When measuring the 10% to 90% rise time, one can determine the oscilloscope bandwidth as shown in my previous blog entry. The rise time of channel 1 through 4 with a 50 Ω termination was in the order of 680 ps which corresponds to a -3 dB bandwidth of 514 MHz.
Menus and Settings
The menus and settings are easily accessible through push buttons and knobs. The response is good, the menus and sub-menus are arranged in a logical order. Some settings are a little bit hidden, e. g. the switch between XY and YT display modes and waveform average settings. Nevertheless, with a little bit of practice, one will memorize the location of the settings automagically. The numerical keyboard is very convenient as soon as exact setting values are needed (e. g. if you want to set the trigger level to an arbitrary value, you don’t have to turn the knob and fine-tune).
Tektronix WaveStar and Remote Control via GPIB
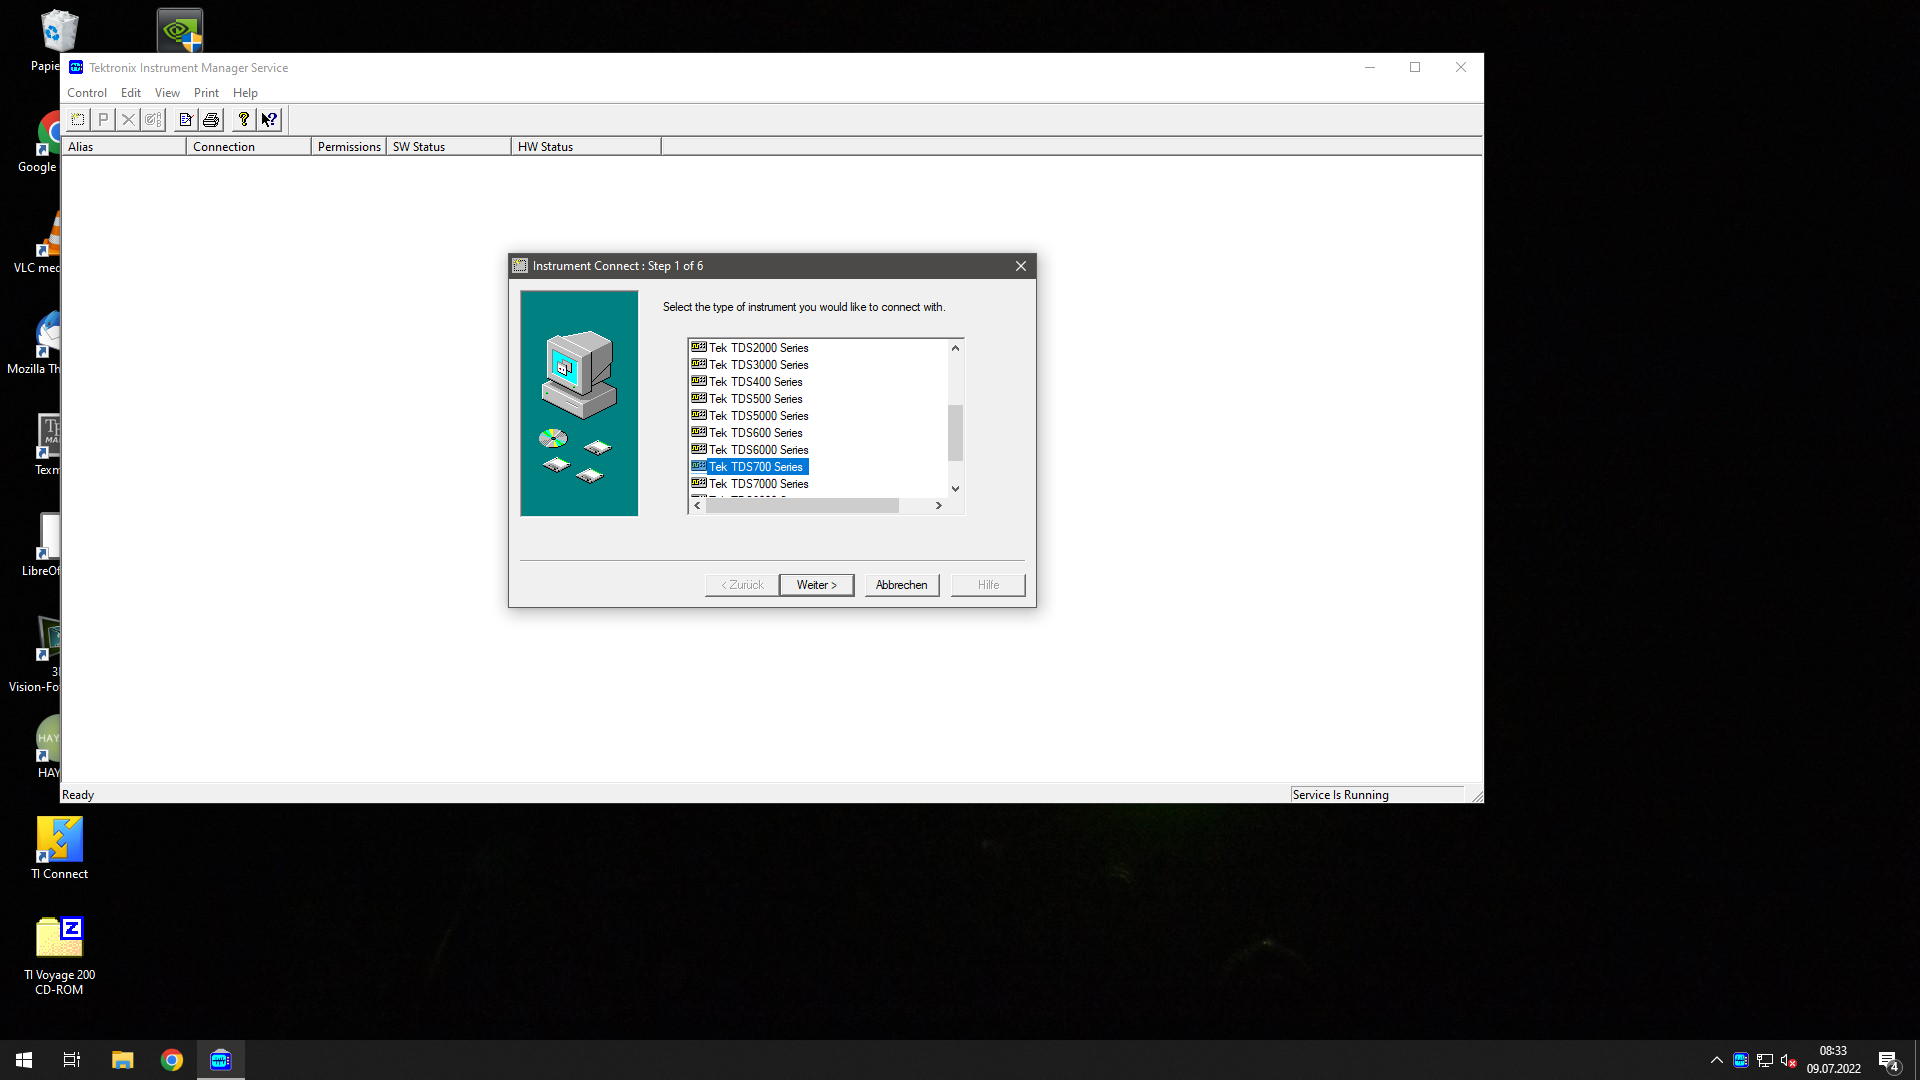
I must admit, this one blew my mind. I was concerned how to transfer screenshots and images from the oscilloscope to my PC. I have bunch of 3.5″ diskettes lying somewhere around and an “old PC” (IBM ThinkCentre from the early 2000’s) which could be used for data transfer. However, transferring the data from oscilloscope to an ancient PC and from there to the local network would have been a workflow horror. According to the oscilloscope manuals, the data transfer was possible either via serial interface (RS-232) or the general-purpose interface bus (GPIB). Older oscilloscopes with GPIB interface (e. g. the Tek 2465B) can be controlled remotely but the user is unable to readout the measurements. TDS Series oscilloscopes do have this capability! It’s possible to control the oscilloscope remotely and fetch the waveform data in a human-readable ASCII format. The communication with the oscilloscope can be established either via RS-232 or GPIB. The setup is straight-forward in case of GPIB: set up a GPIB address on the device, connect the oscilloscope via a GPIB controller to the PC, install VISA drivers and it should work. Once everything is installed, the communication with the oscilloscope can be checked by sending the *IDN? command.
Installing Tektronix WaveStar and Setting Up the Oscilloscope Communication
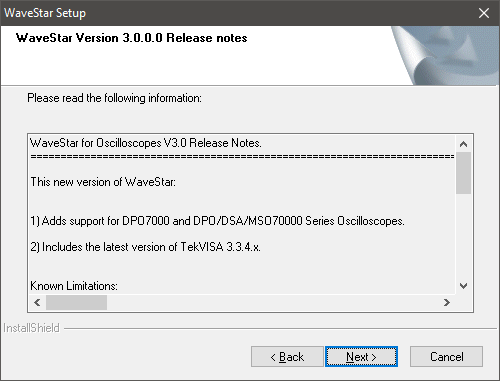
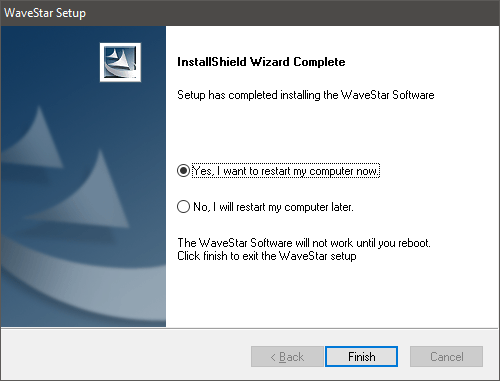
The Tektronix WaveStar Software manages the communication between the remote controllable oscilloscope and the PC. Unfortunately, the software isn’t maintained or supported by Tektronix anymore. I’m not sure if WaveStar can be obtained from the Tek website directly – however, there is a downloadable ZIP file on TekWiki. The product key for this application is available on the internet (e. g. Tektronix user forum). I have successfully installed WaveStar on my Windows 10 (version 21H2) PC. Windows 7 or Windows XP should work, too. I’ve set up an image gallery with screenshots from the installation.


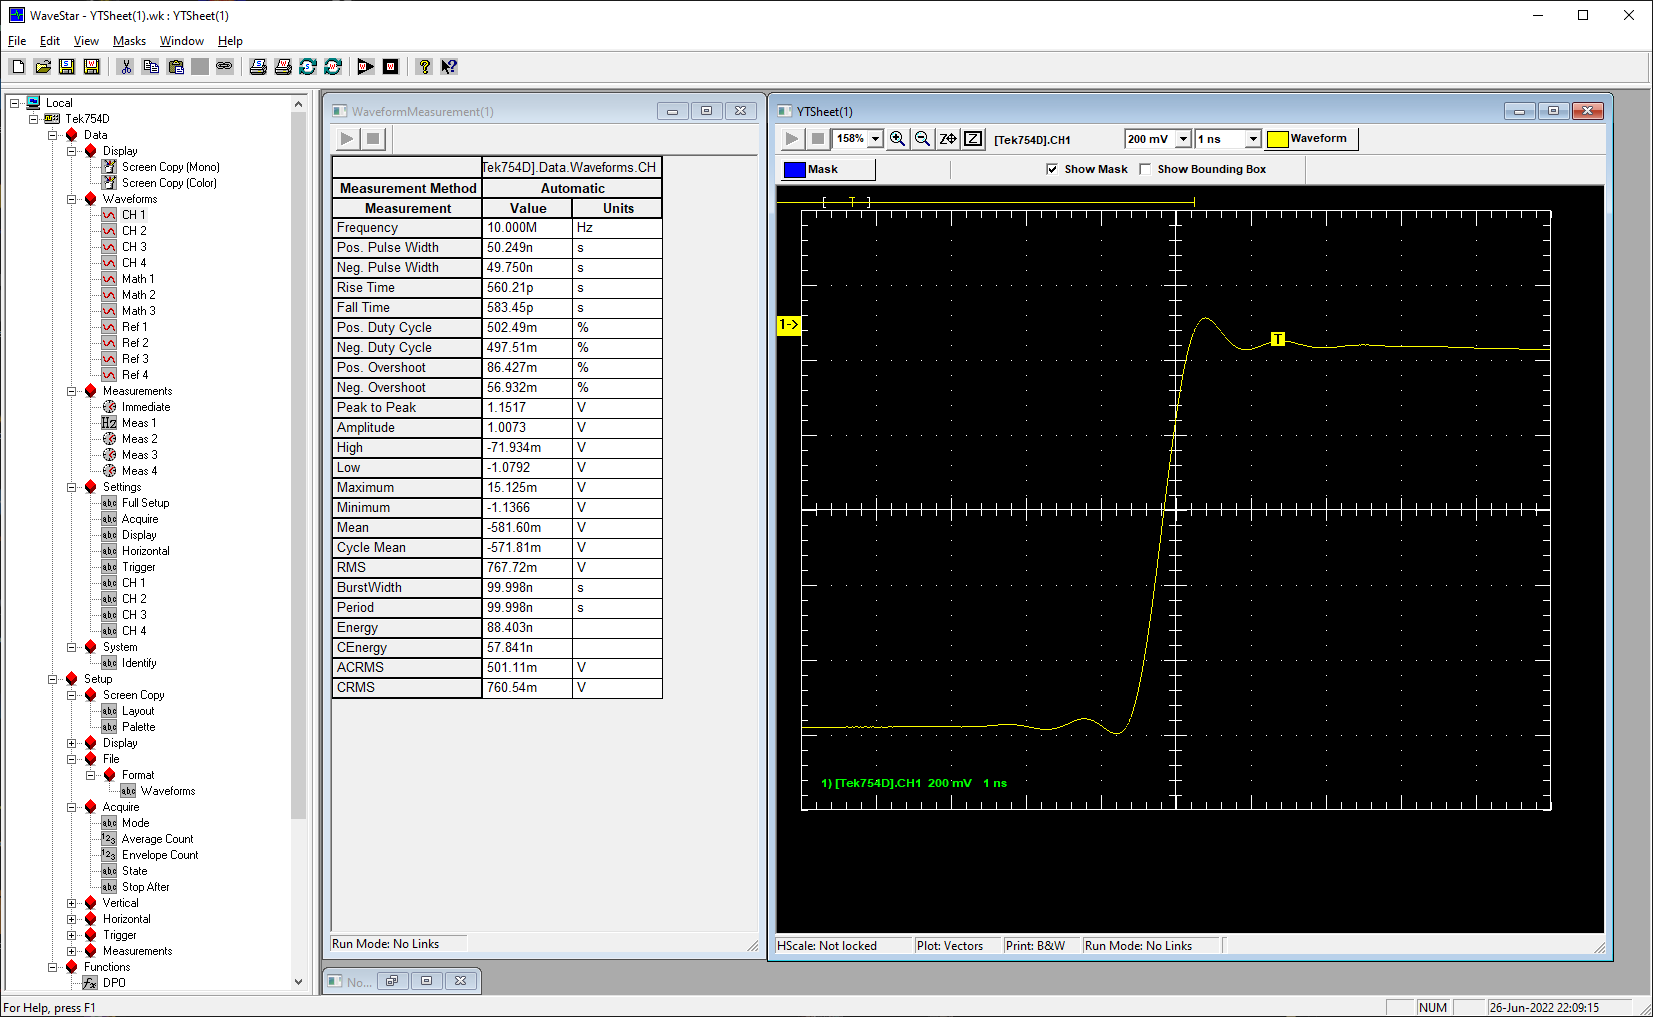
Tektronix WaveStar GUI
Using the Graphical User Interface or GUI wasn’t very intuitive after starting it. WaveStar has a Explorer View which allows access to the oscilloscope functions, such as settings, measurements, cursors etc. In order to transfer data from the oscilloscope to the PC, one has to generate a new datasheet. The selection of datasheets leads to different types of measurements. The YTSheet for example is able to plot the voltage vs. time. In order to create a “screenshot”, one has to create a new datasheet “NotesSheet” and drag-and-drop the “Screen Copy” from the Explorer View Local > TekTDS454D > Data > Display > Screen Copy (Color) into the newly created NotesSheet. After downloading the Screen Copy into the NotesSheet, it is possible to copy & paste it into different applications, such as LibreOffice Writer or MS Paint. The resolution of the image is 640 x 480 px and good enough for quick documentation purposes.

Further Data Processing
After playing few hours with WaveStar, I figured out how to extract measurement data in different ways: as vector graphics and as comma separated values or CSV. Vector graphics are very nice when it comes to publication quality images. It is possible to print out the YTScreen as a PDF file (Windows 10 offers a PDF printer driver natively, otherwise you’ll have to install one manually). The informations inside of the PDF are vector graphics which can be imported into a suitable program such as InkScape (another well-known programs would be Corel Draw or Adobe Illustrator). InkScape is an open source vector graphics editor which allows to manipulate vector graphics. Vector graphics are basically numbers which contain x,y-coordinates for lines to be drawn. Bitmap graphics on the other hand are color and brightness informations stored in a matrix. Whenever scaling bitmap images, one has to deal with (ugly) scaling artefacts where vector graphics can be scaled (or zoomed in) indefinetely.

Last but not least, I was able to export the WaveformTabular data into a CSV file. A CSV file can be loaded into a spreadsheet application such as LibreOffice Calc or Microsoft Excel. The waveform data can be processed afterwards – doing statistics or digital signal processing (e. g. with Python) can be done very easily!
Conclusion
Well, I’ve got myself a very powerful digital oscilloscope now. I still haven’t tested the full capabilities of this instrument but I’m very satisfied with its performance at this point and can recommend it to anyone seeking a 20-30 year old instrument. Although I paid far too much for it (it was well over 500 EUR), it was worth it. I’ll test its measurement capabilities during my vacation which is starting next week 😉
Tektronix TDS 754D, Four Channel Digital Phosphor Oscilloscope Read More »